What is Microsoft Excel?
Microsoft Corporation made Microsoft Excel, which is a spreadsheet program. It comes with Microsoft Office and is one of the most popular tools for organizing, calculating, analyzing, and visualizing data. Using rows, columns, and formulas, Excel makes it easy and quick for people to do complicated math, statistics, and logic.
People in many fields, like business, finance, engineering, research, and education, use Excel. It has useful tools for working with large amounts of data, such as formulas, charts, graphs, pivot tables, and data analysis tools.
A spreadsheet is a computer application that allows users to organize data in tabular form (rows and columns). Microsoft Excel is one such spreadsheet program that enables users to enter, calculate, analyze, and visualize data effectively.
Main Features of Microsoft Excel
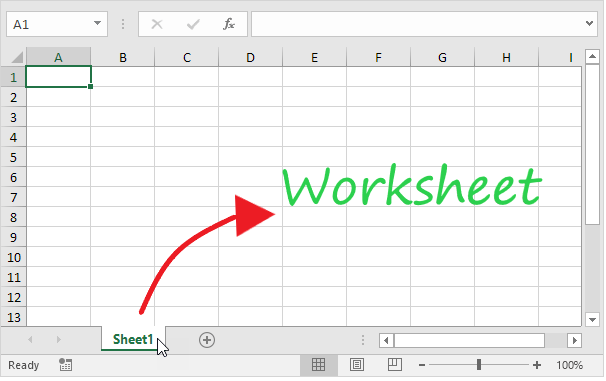
- Workbook and Worksheet:
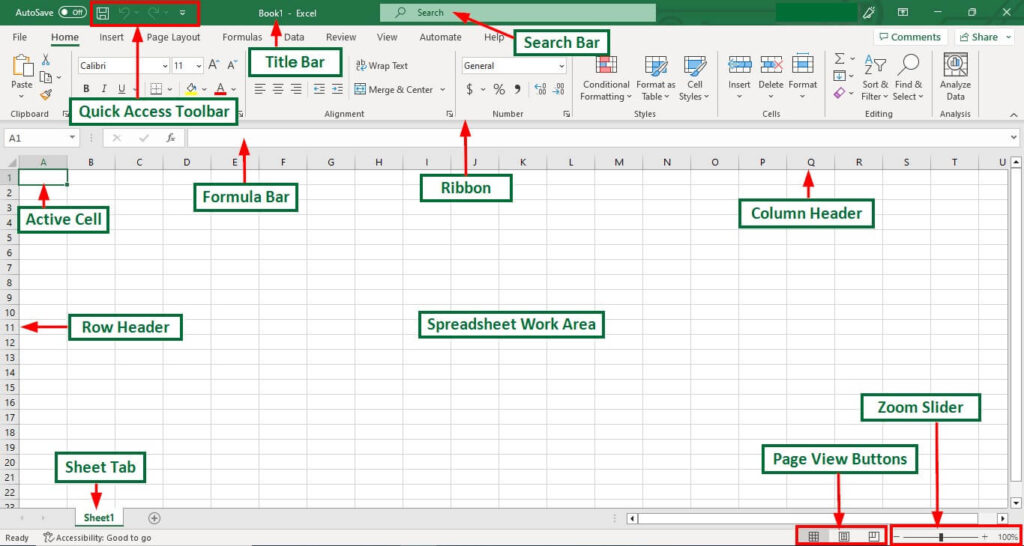
An Excel file is called a Workbook, and each workbook can contain multiple Worksheets (pages). Each worksheet consists of rows and columns, forming cells where data is entered. - Rows and Columns:
- Rows are numbered (1, 2, 3, …).
- Columns are labeled alphabetically (A, B, C, …). {The intersection of a row and a column forms a cell (e.g., A1, B5).}
- Formulas and Functions:
Excel allows users to perform mathematical calculations using formulas (like =A1+B1) and built-in functions (like SUM, AVERAGE, IF, COUNT, VLOOKUP, etc.). - Charts and Graphs:
Data can be represented visually through bar charts, pie charts, line graphs, and other graphical tools for better understanding and presentation. - Data Analysis Tools:
Excel includes features like Pivot Tables, Goal Seek, Data Validation, and What-If Analysis that help in analyzing data trends and relationships. - Formatting Features:
Users can change font styles, colors, cell borders, alignment, and number formats to make data more readable and professional. - Automation with Macros:
Excel allows users to record and run macros—a sequence of instructions written in VBA (Visual Basic for Applications)—to automate repetitive tasks.
Uses and Applications of Microsoft Excel
- Business and Finance:
E Preparing budgets and financial reports.
E Tracking sales and expenses.
E Performing profit/loss analysis.
- Education:
E Maintaining student records, grades, and attendance.
E Analyzing research data.
- Data Analysis:
E Using Pivot Tables and charts to summarize large datasets.
E Performing statistical and logical analysis.
- Inventory and Payroll Management:
E Tracking stock levels, employee salaries, and schedules.
- Scientific and Engineering Calculations:
E Performing formula-based and numerical computations.
- Project Management:
E Creating timelines, Gantt charts, and resource planning sheets.
Advantages of Microsoft Excel
- Easy to Use: Simple and user-friendly interface.
- Accuracy: Performs calculations with high precision.
- Speed: Handles large amounts of data quickly.
- Data Visualization: Provides charts and graphs for better presentation.
- Automation: Saves time through macros and templates.
- Compatibility: Can import/export data from various sources like CSV, databases, etc.
Disadvantages of Microsoft Excel
- Limited Data Handling: Cannot manage very large datasets efficiently; may slow down or crash.
- Prone to Errors: Manual data entry and formula mistakes can cause wrong results.
- Low Security: Password protection is weak; not ideal for confidential data.
- Difficult Collaboration: Multiple users editing can create version conflicts.
- Hard to Audit: Tracing formulas and changes is difficult in large sheets.
- Not a Database Tool: Lacks advanced database management features.
- Needs Skill: Complex functions and macros require advanced knowledge.
- Performance Issues: Complex formulas reduce speed and reliability.
- Limited Visualization: Basic chart options compared to tools like Power BI.
- Compatibility Problems: Files may not work properly across different versions.
Formulas
Basic Excel Formulas
- Total / Adds two numbers or cells
- =A1+B1 (Adds the values in A1 and B1)
- All values in the range
- =SUM(A1:A10) (Adds cells from A1 to A10)
- Subtracts one value from another
- =A1-B1 (Subtracts B1 from A1)
- Multiplies two numbers
- =A1*B1 (Multiplies A1 and B1)
- Divides one value by another
- =A1/B1 (Divides A1 by B1)
- Raises to power
- =A1^2 (Squares the value in A1)
- Finds the mean value
- =AVERAGE(A1:A10) {Average of A1 to A10}
- Finds the largest value (Maximum)
- =MAX(A1:A10) {Highest number in range}
- Finds the smallest value (Minimum)
- =MIN(A1:A10) {Lowest number in range}
- Counts numeric cells
- =COUNT(A1:A10) {Counts how many cells have numbers}
- Counts all non-empty cells
- =COUNTA(A1:A10) {Counts both text and numbers}